Qualta Consulting LLC
Vorteks Correlation View
We are the software developers behind the magic of changing the Visual Analytics to be more in line with the analytical thought process. Business and Military Intelligence Analysts are looking beyond what is in the data available and more for relationships and correlations throughout the data.To do this, we have designed and developed a Correlation View. The Correlation View begins with a simple Chord diagram, which is a graphical method of displaying inter-relationships between data in a field. The chord is a circle of geometric line segment whose endpoints both lie on the circle.
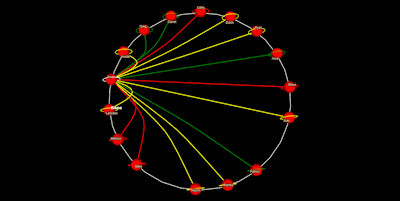
Figure 1: Single Cord Plane View
We then take this basic geometric design and add more 2-more chords to determine and display the co-occurrences and correlations of values within the fields. The size of the sphere indicates the number of documents that contain the values on the chord and the sphere’s colorations provides additional detail to the View.
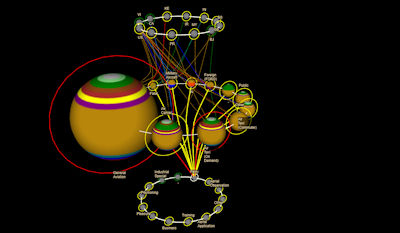
Figure 2: Correlation View: 3D
The Correlation View in 2D shows the chords straightened and also displays the field’s linear values. When a sphere is selected, the direct correlations are shown in a red connecting lines. The 2nd-degree indirect correlations are displayed with yellow connecting lines. The 3rd -degree indirect connections are shown with green connecting lines.
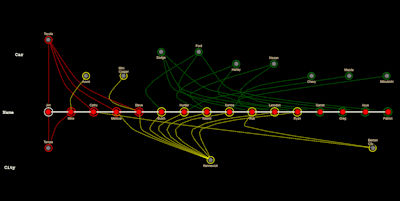
Figure 3: Correlation View with 3-degrees of separation.